GGR vs. NGR – Two Most Popular Metrics in the Gambling Industry
What is Gross Gaming Revenue (GGR)
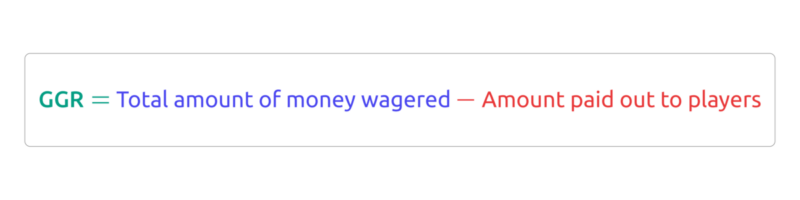
Gross gaming revenue (GGR) is the total amount of money players wager minus the amounts paid out to them as winnings.
Essentially, GGR represents the total revenue generated by any online gambling business before any costs or expenses are taken into account.
GGR = Total amount of money wagered – Amount paid out to players
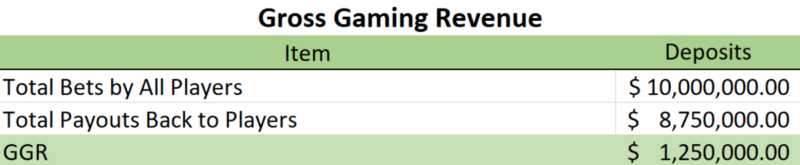
Suppose your online casino received $10,000,000 in bets this month and paid out $9,000,000 in winnings to players.
You can calculate the GGR this way:
GGR = $10,000,000 – $8,750,000 = $1,250,000 (“Total amount of money wagered” – “Amount paid out to players”)
It’s important to mention that some resources use the “Amount paid out to players” and the RTP interchangeably.
This is wrong!
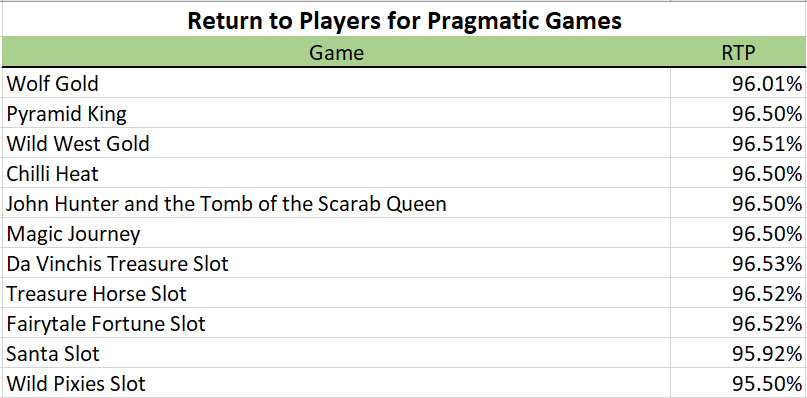
The RTP refers to the percentage of wagered money that a game or machine is expected to pay back to players over time.
This is a given theoretical percentage for the return to player (RTP)
For example, if a game has an RTP of 96%, it means that, on average, players can expect to receive back 96% of the total amount they wagered on that slot machine.
Over a long period of time. In theory.
The remaining 4% represents the house edge, which is the casino’s built-in advantage to ensure profitability.
So, the “Amount paid out to players” can’t be the same as RTP, because the amount paid out to players represents:
- The amount of money players receive as winnings from their bets.
- It is the sum of all the prizes and payouts during a specified period.
Net gaming revenue (NGR)
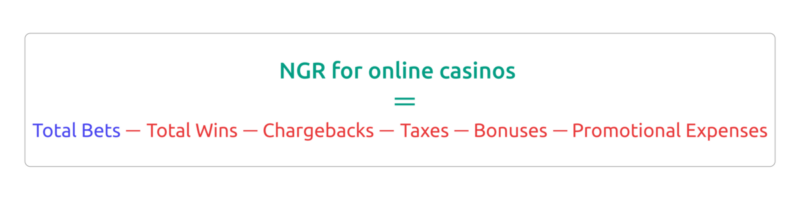
Net gaming revenue (NGR) represents the total revenue generated by a gambling business after all costs and expenses have been deducted. These costs may include taxes, fees, commissions, bonuses, and other expenses.
NGR for online casinos = Total Bets – Total Wins – Chargebacks – Taxes – Bonuses – Promotional Expenses
Online Casino Example: Let’s say an online casino recorded the following figures:
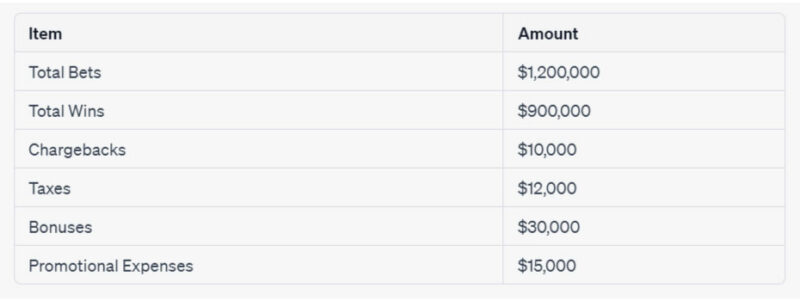
NGR for the online casino: $1,200,000 – $900,000 – $10,000 – $12,000 – $30,000 – $15,000 = $233,000
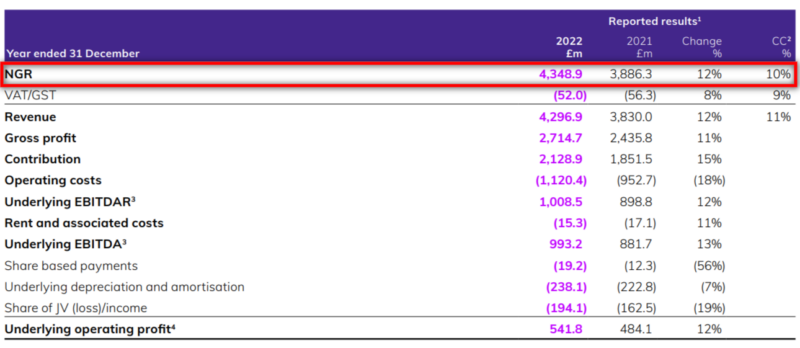
This is what NGR looks like on financial statements:
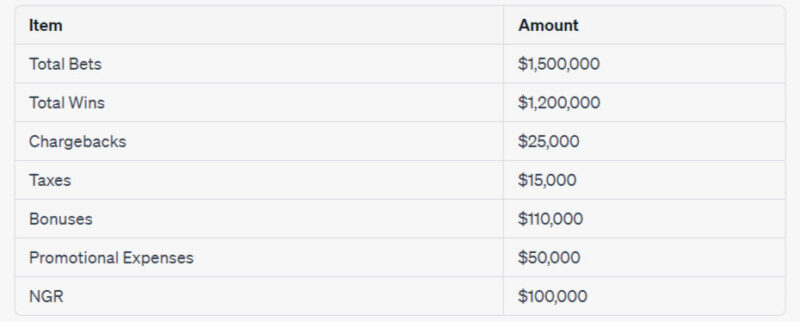
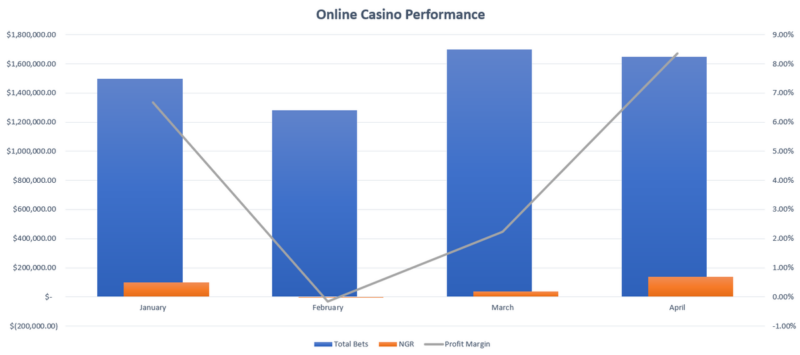
By comparing NGRs with total player wagers, you can assess whether you generate sufficient revenue to remain profitable.
Suppose in January your online casino generated $1,500,000 in total bets. You paid back all the winnings, chargebacks, taxes, bonuses, and promotional expenses. Your NGR was $100,000
That’s roughly a 6.67% profit margin. ($100,000/$1,500,000) x 100
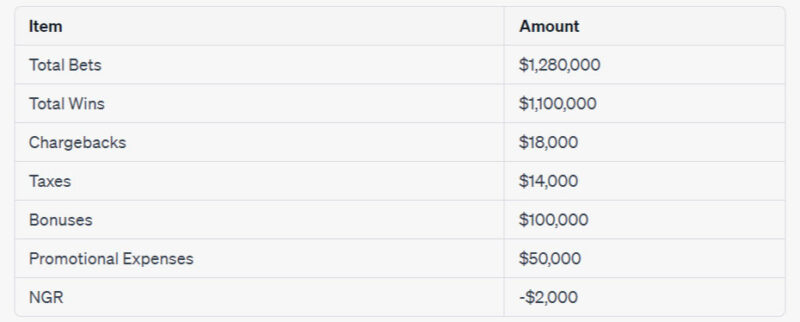
You had a slow month in February, and total bets are down fifteen percent. With no change in expenditures, the NGR is now -$2,000
Let’s look into another example:
Your March was back to normal, but you decided to give away more promotions and bonuses to reactivate your old customers.
As a result, you generated $1,700,000 in total bets.
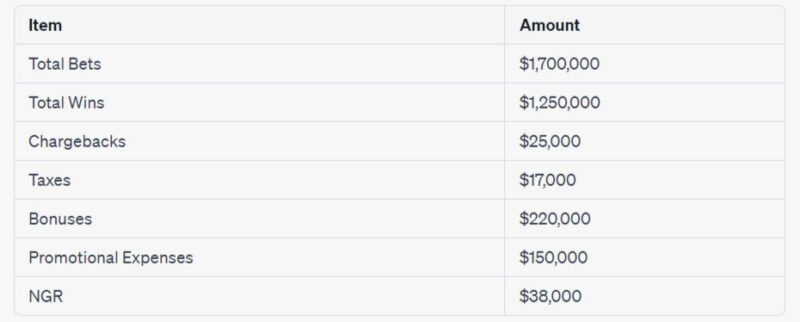
That’s a 2.24% profit margin. ($38,000/$1,700,000) x 100
You increased your total bets but also had to pay more for bonuses and promotional expenses in March.
This can be a viable strategy to increase the profitability of your online casino if the overall activity of your players remains at the same level in the future.
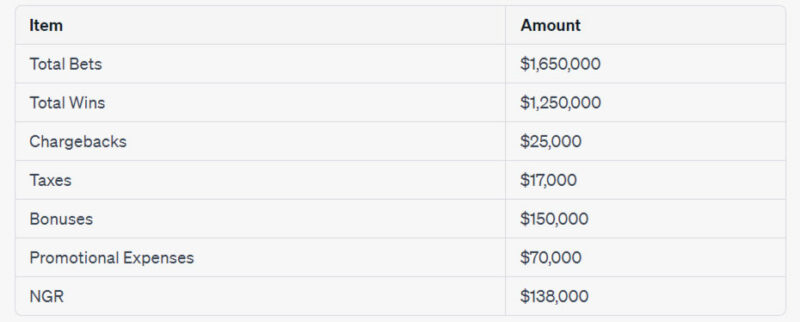
That’s 8.36% profit margin ($138,000 1,650,000) x 100
A significant improvement over the previous months, considering that you achieved this without bringing in new players. Only by engaging your active players and reactivating a list with your old ones.
You can learn more about customer retention in this post here. It is called “How to promote online casino and increase revenue by 25% (for free).”
Online gaming license is an essential part of any online casino and sports betting website. It makes it possible to develop the best competitive product, connect payment methods and eliminate operational risks. Some companies also require an online gambling certificate to prove the integrity of their software. At License Gentlemen, we specialize in creating solid structures and securing licenses with a 100% success rate.
Compare your GGR and NGR to industry averages.
You can actually compare NGR with similar-sized casinos or industry averages. If your NGR lags significantly behind industry benchmarks, it may indicate that it’s time to change things.
Other KPIs
Gross Gaming Revenue (GGR) and Net Gaming Revenue (NGR) metrics are just the tip of the iceberg.
Among the online casino KPIs you should monitor are:
- Bets-to-deposits to see if your players are active enough.
- NGR to Deposits, which allows you to assess the profitability of your business.
- Conversion rate metrics like – “Visits to Registrations” and “Registrations to Deposits”, so you can see how well you’re converting your website users.
- Customer Lifetime Value (LTV) allows you to segment your players and increase profits by targeting your VIPs.
- Churn Rate. A low churn rate shows that your players are having a great experience. This is great because it allows you to keep printing money without having to constantly recruit new customers.
- Average Revenue Per User (ARPU) allows you to identify different player segments, target them with unique promotions, and increase profits.
- Cost Per Acquisition (CPA) is probably the most important metric. You need to know how much it costs to acquire a new user. This knowledge allows you to make quick decisions and scale your business.
- Monthly Active Users (MAU) help you measure the success of user acquisition and retention strategies.
Check this post to learn which online casino KPIs you should monitor right now!
Conclusion
Gross gaming revenue (GGR) and net gaming revenue (NGR) are essential metrics to measure the performance and profitability of a gaming company.
While GGR represents the difference between all bets and withdrawals, NGR provides a more accurate representation of the company’s profitability.
To calculate NGR, you must also subtract all other costs of running a business.
By tracking these metrics, you can optimize a lot of different things and use the data to improve the financial health of your business.


Comments(0)