


Key Performance Indicators Every Casino Owner Must Monitor in 2026
Online casino KPIs are indicators of whether your casino can grow, retain players, protect margins, and operate safely in a more competitive 2026 market. Casino owners should treat KPIs as references for decisions as when the numbers move, something in the business is speaking.
For casino founders, sportsbook teams, and iGaming startups, the right KPIs help answer a basic business question. Are you turning visitors into loyal players who bring profit? A casino can appear busy with traffic, registrations, and wagers and still lose money until the players turn into retained, verified, depositing players.
This guide explains the most important online casino KPIs to monitor in 2026, including acquisition and engagement, retention, finance, payments, compliance, and business intelligence.
Why KPIs Define Whether Your Casino Survives or Scales
KPIs show whether your casino will last or grow, revealing where real growth happens and where it only looks good on the surface. Instead of trusting broad assumptions like strong traffic or revenue growth, a casino must check the impact of every campaign, player group, payment method, game type, and compliance step.
When signups rise without first deposits, or when Gross Gaming Revenue (GGR) grows while profit falls, the headline number is hiding a deeper issue. Bonus costs, payment fees, weak onboarding, or poor traffic quality can all make performance look stronger than it really is. Experienced operators do not celebrate a rising number until they know what created it and what it cost.
Leadership can only spot these differences with good business intelligence, turning platform data into actionable management insight. Intuition helps in gambling operations, but KPI reporting tells you where to cut spend, where to fix the product, and where to double down. A casino owner needs numbers that explain what to do next.
Starting a gambling business requires a valid iGaming license, reliable localized payment methods, and player management systems that meet compliance requirements in their target market. A turnkey casino backend can simplify this process by combining game aggregation, fraud monitoring, compliance tools, payment support, and business reporting in one platform. With the right setup, new operators can track player activity, monitor revenue, manage risk, and make better decisions as the casino grows.
The Five KPI Categories Every Operator Must Track
Every casino operator should track five KPI categories: Acquisition, Engagement, Retention, Finance, and Operational Compliance. Each category addresses a different business question, helping owners identify the real source of performance issues. One attractive KPI can mislead you, while a connected set of KPIs tells you where the business is actually winning or bleeding money.
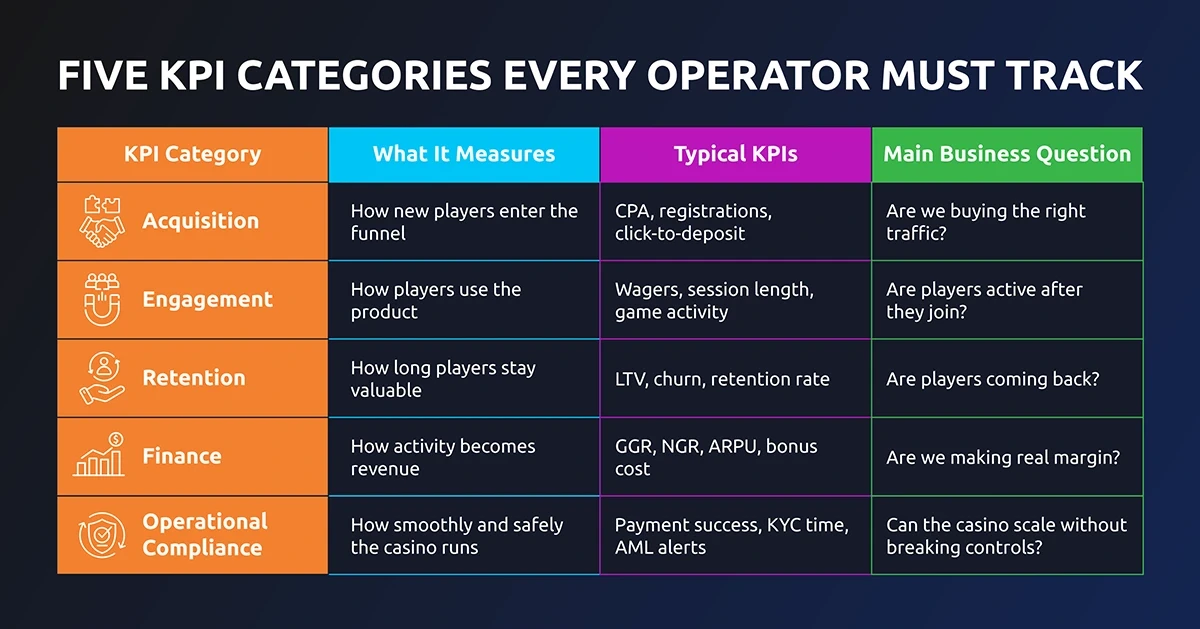
Strong operators connect these categories before making decisions because no KPI provides enough context on its own. Cost Per Acquisition becomes meaningful only when compared with Lifetime Value, registrations need to be evaluated alongside deposits, and GGR should always be reviewed alongside Net Gaming Revenue.
Looking at how metrics interact gives casino owners a far more accurate picture of performance than focusing on a single strong number in isolation.
Acquisition KPIs: Bringing New Players In
For a new casino or sportsbook, the first question is whether marketing investment is bringing in players who actually deposit and generate value. The metrics in this category help operators measure traffic quality, conversion efficiency, and the effectiveness of their acquisition strategy.
The acquisition funnel begins when a potential player sees an ad, a search result, an affiliate link, or a brand mention. The player then visits the site, creates an account, completes onboarding, makes a first deposit, and starts playing.
Every step matters because acquisition money is spent before the operator knows whether the player will ever pay back the cost. Weak acquisition tracking is how casinos overpay affiliates, buy low-quality PPC traffic, or celebrate campaigns that never become profitable.
Never judge acquisition by registrations alone as free-account traffic can make a marketing report appear successful while the cashier stays empty.
Cost Per Acquisition (CPA / CAC)
CPA, also known as CAC, shows how much the casino spends to acquire a qualified player. In iGaming, a qualified player usually means a first-time depositor, not a person who only created an account.
It is given in the industry that every player starts as a cost before becoming revenue. A casino that pays $300 for a depositor must know whether that player can realistically return more than $300 after bonuses, payment fees, taxes, and churn.
Formula: CPA / CAC = Total Acquisition Spend / Number of New Depositing
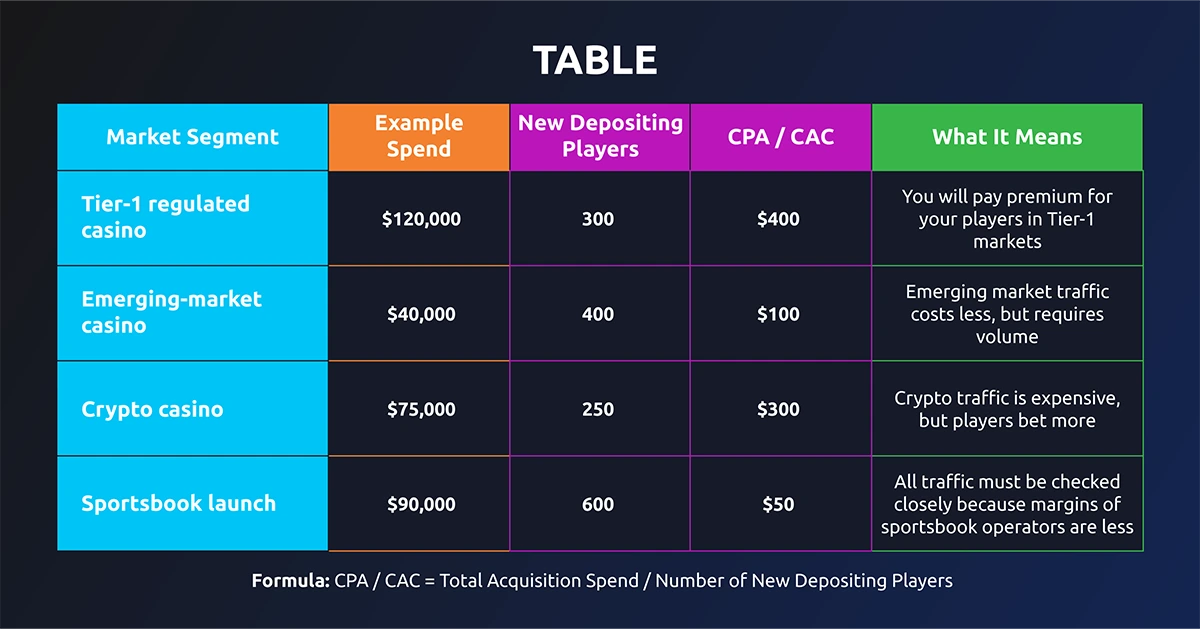
PlayersAcquisition spend should include paid media, affiliate payments, agency costs, tracking tools, creative production, and direct promotional costs. The biggest mistake is calculating CPA using registrations alone. A player who signs up but never deposits has not yet become a revenue-generating customer.
New Player Registrations
Account creation volume provides a basic view of how many users join the platform during a set period. Registrations matter because they show whether the market is responding to your offer, but they do not prove that the business is healthy. A registration only becomes commercially useful when the player verifies, deposits, plays, and returns.
A sudden rise in registrations may come from strong marketing, but it can also reflect bonus hunters, poor partner traffic, fake accounts, or low-intent users. Registration data should always be reviewed, along with first deposits and early retention as they can only be considered successful when players complete verification, make a deposit, and return without relying on constant bonus incentives.
SEO traffic may yield fewer signups but deliver stronger long-term value, while influencer campaigns may drive rapid account growth but produce less consistent deposit activity.
For example, a PPC campaign may bring 2,000 registrations in one week, while SEO brings only 300. If the SEO cohort deposits again in months two and three while the PPC cohort disappears after the welcome bonus, the smaller channel may be the stronger business asset.
Click-to-Register, Click-to-Deposit, Registration-to-Deposit
Many acquisition losses happen before a player ever reaches the game lobby, which is why operators track click-to-register, click-to-deposit, and registration-to-deposit rates. Together, these micro-funnel KPIs show exactly where potential players drop out before real-money play begins.
- Click-to-register measures how many visitors create an account after arriving from a traffic source. A low rate, often under 20%, may point to a weak landing page, unclear offer, poor mobile experience, or low player trust.
- Click-to-deposit measures how many visitors place a money deposit. A lower than 0.5% often points to problems in registration, KYC, cashier design, or payment availability.
- Registration-to-deposit measures how many account holders make a first deposit. If the rate drops below 15%, it can usually be attributed to failure verification checks, complicated biometric KYC, or missing and unoptimized local payment methods required by the jurisdiction.
A strong click-to-register rate with a weak registration-to-deposit rate usually means the marketing message is working, while the product flow or payment process needs improvement.
Marketing ROI by Channel
Marketing budgets should be allocated according to profitability rather than traffic volume. Channel-level ROI analysis helps operators identify which sources generate valuable players.
Formula: Marketing ROI = (NGR from Channel – Channel Cost) / Channel Cost x 100
NGR means Net Gaming Revenue. It is the revenue left after key deductions such as bonuses, payment fees, gaming taxes, and other operating charges.
It matters because different channels pay back at different speeds. PPC may deliver fast registrations, while SEO or direct traffic often generates stronger long-term LTV. Operators who judge every channel by the same short window often cut the traffic that would have paid back later.
Bonus Conversion Rate
Promotions only create value when they encourage ongoing real-money activity. Bonus conversion rate measures how effectively that transition occurs.
Bonus Conversion Rate = Players Who Complete the Bonus Path and Deposit Again / Players Who Claimed the Bonus x 100
A bonus path covers the journey from claiming an offer to completing its requirements and continuing to play with real funds. If many players claim bonuses but few deposit again, the promotion may be attracting low-value users.
Good bonuses reveal whether a promotion is creating genuine player value or simply generating short-term activity. A welcome offer should encourage players to explore the casino and continue depositing afterward, not condition them to engage only when free money is available.
Given that, do not chase a 100% bonus conversion rate. A casino that converts everyone is often giving away too much, attracting the wrong players, or ignoring fraud and bonus abuse.
Engagement KPIs: Keeping Players Active
When you look at engagement KPIs, you see whether players are actually using the casino after joining. These numbers reveal if your games, user experience, promotions, sportsbook markets, and cashier flow are strong enough to keep people coming back.
When a casino attracts many new players but cannot keep them engaged, the problem may lie in the product. Engagement should be reviewed daily during launch periods and weekly once the business becomes more stable.
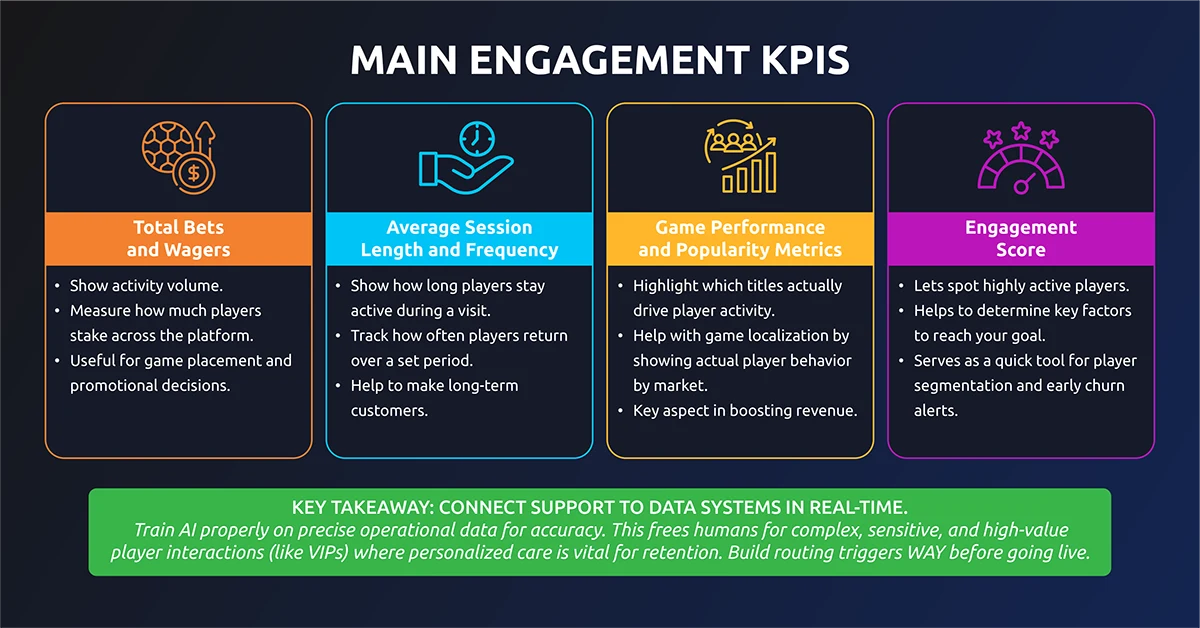
Strong engagement is what turns acquisition spending into long-term revenue. Players who return regularly, explore different products, and continue depositing give the casino a chance to recover acquisition costs and build sustainable value over time.
Only the market decides what games players want, regardless of the operator’s opinion.
Total Bets and Wagers
Total bets and wagers measure how much players stake across the platform. This metric shows activity volume, but it must be split by product vertical to be useful.
Each type of game behaves differently: slots tend to produce many small rounds, live casino games often have fewer sessions with higher stakes, and sportsbook activity usually spikes during major events then drops off.
Operators should track wagers by vertical first, then they can review game provider, market, currency, player segment, device, and bonus use. Wager volume helps operators identify which games, providers, and product categories are genuinely driving player activity.
A casino may offer hundreds of titles, but only a relatively small group of games often generates most of the wagering, retention, and revenue, making this KPI useful for game placement and promotional decisions.
Average Session Length and Frequency
Average session length shows how long players stay active during a visit, while session frequency shows how often they return over a set period. Players who spend meaningful time on the platform and return regularly are more likely to become long-term customers.
These two KPIs help operators understand whether the casino is becoming a player habit. A user who returns four times per week for moderate sessions may be more valuable than a user who plays once for a long period and never returns.
Session data shows whether players are building a habit or simply testing the platform. Frequent return visits increase acquisition payback and long-term value, while one-time bonus-driven sessions rarely generate sustainable revenue.
Longer sessions are not always better as responsible gambling controls must still apply. Very long sessions, sudden deposit spikes, or major changes in behavior should be reviewed carefully, while active, consistent, and safe engagements are measures of responsible gaming habits.
Game Performance and Popularity Metrics
Game performance metrics highlight which titles actually drive player activity in your market instead of basing it merely on popularity metrics, which are the most known games in the system. A game that works in one region may flop in another.
For example, a casino targeting Indian players should not assume that games popular in the Chinese market will produce the same retention. Game localization should follow actual player behavior by market, not the operator’s personal preference or the provider’s global ranking.
A good rule of thumb is to keep games at the top of the lobby because players actively engage with them and generate value as reflected in the report, regardless whether the provider is famous or not.
Do this part right and you will see a 10%-20% boost in revenue immediately.
Placement and promotion should be based on real player behavior, not assumptions, so these metrics can be used to guide which games get featured or removed from the lobby.
Engagement Score (Composite Metric)
Combining activity signals into one engagement score lets teams spot highly active players and those who need attention at a glance. This helps CRM, product, and VIP teams respond faster.
Deposit frequency, playing hours, wager count, game variety, and recent login activity can all be weighted to build an engagement score. Different teams may prioritize certain factors depending on their goals.
An engagement score should not replace detailed KPI analysis, but it serves as a quick tool for player segmentation and early churn alerts. Operators can use it to improve campaign targeting and monitoring.
Retention KPIs: The Real Profit Drivers
Retention KPIs measure whether players return, deposit again, and remain valuable over time. Retention often drives profitable growth because acquisition costs are paid early, while player value builds over months.
A casino with retention issues must keep acquiring new players to replace lost activity. A casino with strong retention can scale more efficiently because each acquired player has a better chance of creating long-term value.
When players return, the business earns more from each acquisition dollar. When players leave early, even a strong acquisition campaign can become hard to scale.
Customer Lifetime Value (LTV) and Cohort Analysis
Customer Lifetime Value (LTV) estimates the total net value a player brings, while cohort analysis tracks how groups of players develop value over time. LTV matters because it shows whether acquisition costs can be recovered profitably, while cohort analysis is a way to answer a business question, such as which traffic source pays back, which market retains players longer, or which player group stops depositing after the welcome bonus.
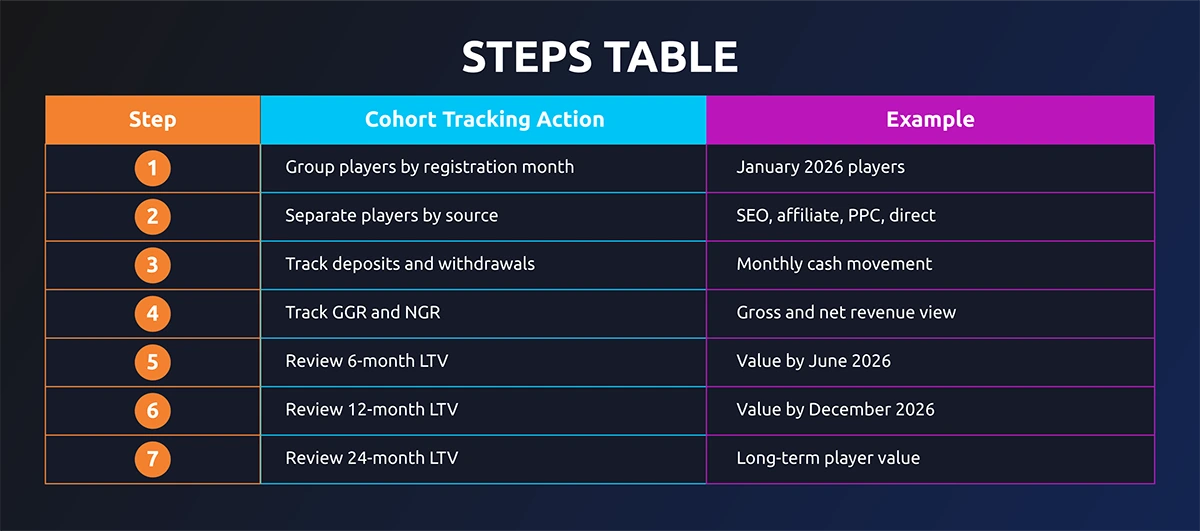
Cohort tracking prevents false conclusions by revealing how results change over time. A campaign that starts slow may turn profitable later, while a strong launch might fizzle out after bonuses end.
In one project we worked on, a casino operator saw that players acquired through SEO were generating an average LTV of around €200. Based on that result, the operator decided to scale PPC acquisition and was willing to pay up to €70 per depositor. The campaign underperformed because the PPC cohort behaved very differently from the SEO cohort and generated an LTV closer to €120.
The issue was not the PPC spend itself, but the assumption that players from different acquisition channels would deliver the same long-term value. Each source, SEO, PPC, affiliates, influencers, and direct traffic, needs its own cohort view before the operator increases spend.
Player Retention Rate
Player retention rate reveals how many players stay active over time and is a clear sign of product strength and loyalty.
Formula: Retention Rate = Returning Active Players / Original Active Players x 100
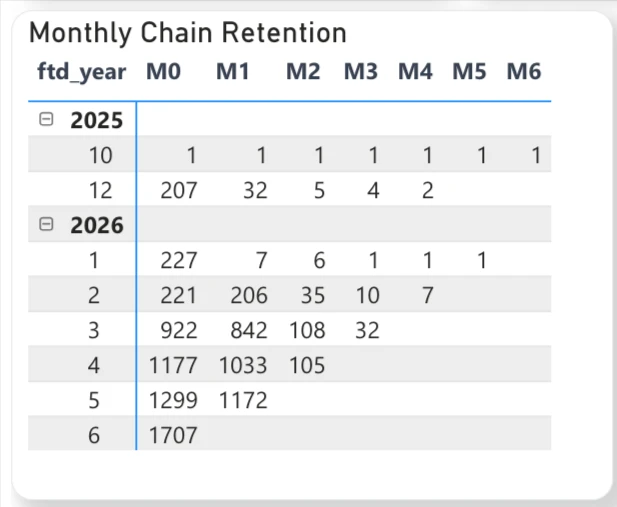
A Monthly Chain Retention graph as shown below demonstrates how many acquired players continue depositing in later months. M0 is the acquisition month, while M1, M2, M3, and beyond show how many of those same players returned to deposit again. If a cohort drops sharply after M1, operators should investigate onboarding, payments, CRM, bonuses, or game selection.
For example, if 1,177 players deposit in M0 and 1,033 deposit again in M1, the first-month retention is strong. If the same cohort falls close to 100 players by M2, the casino has a second-month retention problem, not just a traffic problem.
Tracking Day 1, Day 7, and Day 30 retention rates helps spot early drop-off issues, especially for new casinos. Monthly retention then shows whether players continue to bring value after the first deposit cycle.
Churn Rate and Predictive Churn Detection
Churn rate tracks the percentage of players who stop being active, while predictive churn detection looks for early warning signs before they leave. Churn often becomes visible in player behavior long before it appears in revenue reports, giving operators a chance to intervene early.
Common warning signs include fewer logins, lower deposit amounts, reduced wager volume, abandoned cashier sessions, ignored CRM messages, and sudden changes in game behavior. These changes usually show up before players become fully inactive.
Automated CRM tools can flag these patterns and trigger a response which should not always be a bonus. This exists because acquisition payback often takes more than one deposit cycle. If a player costs money to acquire and leaves after one short session, the casino may never recover the CPA, even if the first deposit looked promising.
CRM exists to protect payback, not to throw promotions at every quiet player. In many cases, the right fix is faster support, better payment options, clearer terms, or a more relevant game recommendation.
VIP Retention and High-Value Player Stickiness
VIP retention tracks how well the casino keeps its top 2–5% of players, who often contribute a large share of total revenue despite making up a small part of the user base.
Using a VIP dashboard helps you keep an eye on player value, payment experience, service quality, game preferences, bonus habits, and responsible gambling. Noticing changes early, like when an active VIP becomes less responsive, lets you act before loyalty fades.
VIP retention matters because one slow payout, one careless support reply, or one irrelevant offer can push a high-value player to a competitor. High-value players usually expect speed, recognition, and consistency, but they still need responsible gambling controls and risk monitoring.
Your aim should be to protect long-term player value while still upholding responsible gambling. Keeping VIPs comes down to fast payments, personal support, offers that matter, and catching churn risks before they become problems.
Financial KPIs: GGR, NGR, ARPU, and Revenue per User
Financial KPIs show how betting activity turns into actual revenue, so owners need clean financial metrics as high deposits, high wagers, or high GGR do not always mean the business is profitable.
A strong financial dashboard separates player deposits, withdrawals, GGR, NGR, bonus cost, payment fees, tax costs, affiliate commissions, and platform expenses.
Financial KPIs matter because casino growth can be expensive to misunderstand as one market may produce high deposits but weak NGR after bonuses, failed payment fees, withdrawal costs, tax exposure, and affiliate commissions.
Without this separation, management may scale activity that looks strong but weakens margin.
Gross Gaming Revenue (GGR)
GGR is the casino’s gross gaming revenue before deductions, calculated by subtracting total payouts from total wagers.
Gross Gaming Revenue = Total Wagers – Total Payouts
If players wager $1,000,000 and receive $920,000 in payouts, GGR is $80,000.
GGR matters because it is the first layer of revenue, but it does not represent profit. It excludes bonuses, taxes, fees, platform costs, and affiliate commissions.
Operators track GGR because it shows whether the gaming product is producing gross value. They should never stop at GGR because a casino can grow gross revenue and still lose margin once the real operating deductions appear.
Net Gaming Revenue (NGR) and NGR-to-Deposit Ratio
NGR is what remains after bonuses, fees, and taxes are taken from GGR, giving a clearer view of true operating performance and understanding real profit.
Formula: NGR = GGR – Bonuses – Payment Fees – Gaming Taxes – Admin Surcharges
The NGR-to-deposit ratio measures how much net revenue your casino generates from player deposits. Two markets can bring in the same deposit volume but produce very different margins because one may lose more revenue through failed transactions, expensive payment methods, chargebacks, crypto conversion costs, tax exposure, or heavy bonus use.
Tracking the NGR-to-deposit ratio helps operators spot payment processing leakages that deposit volume alone can hide.
It’s important that some payment problems often look like marketing or product problems. If deposits rise but NGR stays flat, the operator may need better routing, cleaner bonus economics, or cheaper payment rails.
GGR shows gaming activity, while NGR and the NGR-to-deposit ratio show whether your casino’s payment setup, bonus structure, and market strategy are actually protecting profit.
ARPU, ATPU, ADPU, ANDPU
Metrics like ARPU, ATPU, ADPU, and ANDPU help operators understand user revenue and transaction behavior, which are useful when comparing markets, campaigns, payment methods, and player cohorts.
| Metric | Meaning | Formula | What It Tells You |
| ARPU | Average Revenue Per User | Total Revenue / Active Users | How much revenue each active user creates |
| ATPU | Average Transaction Per User | Total Transactions / Active Users | How often users transact |
| ADPU | Average Deposit Per User | Total Deposits / Depositing Users | How much depositors add on average |
| ANDPU | Average Net Deposit Per User | Net Deposits / Depositing Users | Deposit value after withdrawals or adjustments |
These metrics should not be used in isolation. High ADPU with high churn can signal weakness, while lower ARPU may be better if retention and acquisition costs are strong.
Bonus Cost as % of GGR
Bonus cost as a percentage of GGR shows how much gross revenue goes to promotions. This KPI helps you avoid bonus strategies that boost activity but hurt margins.
Formula: Bonus Cost % of GGR = Total Bonus Cost / GGR x 100
High bonus costs may be fine at launch if they boost deposits, retention, or LTV. If bonuses rise but NGR drops, you are probably just buying artificial activity.
Operators should review bonus costs by campaign, market, affiliate, and segment to ensure they drive profitable behavior.
Operational and Compliance KPIs (New for 2026)
Operational and compliance KPIs show if your casino can process payments, verify players, manage risk, and support users as you grow. In 2026, these are key data that drive growth.
Revenue can slip even when marketing and product numbers look good if deposits fail, KYC is slow, or support lags, reducing conversion and retention. A player who cannot deposit, withdraw, verify, or reach support does not care how strong the casino’s acquisition strategy looks on a management deck.
Payment Success Rate
Payment success rate shows the percentage of deposit attempts that are approved. Failed payments can quietly hurt your entire acquisition funnel.
Formula: Payment Success Rate = Successful Deposit Transactions / Total Deposit Attempts x 100
Check payment success rate by method, country, device, and player segment to find weak spots. If a market has many signups but few deposits, payment approval could be the issue.
Success in this channel is particularly important because every failed deposit wastes acquisition spend. The player was interested enough to reach the cashier, but the casino failed at the moment money was supposed to enter the business.
Payments and licensing often go hand in hand, making a strong legal setup important for stable banking and processing.
When you are weighing license options before launching, it helps to work with someone who understands how payment realities shape deposits, approvals, and long-term growth.
LicenseGentlemen can bridge the gap between licensing strategy and the practical challenges of running an online casino. In our team we have seasoned professionals with practical experience running online casino. Register for a free consultation.
Withdrawal Speed and Time-to-Payout
Withdrawal speed is the time it takes to cash out earnings or remaining balance from a casino player account. Fast payouts indicate trust, create a better player experience, and often reduce the number of support requests related to pending transactions.
To get an accurate picture, operators should monitor both average and median payout times, along with delayed withdrawals, rejected requests, and manual review bottlenecks. While speed matters, withdrawals still need to pass fraud checks, AML procedures, and responsible gambling controls, since a smooth and secure payout process is often what convinces players to return and deposit again.
KYC and Onboarding Time
For most players, the onboarding experience is judged by how quickly they can start playing after submitting their documents. KYC, which stands for Know Your Customer, is the process used to verify identity, age, and other required information before an account can be fully activated.
When verification takes too long, many players abandon the process before making a first deposit. At the same time, rushing approvals without proper checks can expose the casino to fraud, compliance issues, and regulatory risk.
The most useful way to evaluate KYC performance is from the player’s perspective on how much time passes between document submission and full account approval. A smooth, transparent process improves conversion rates, reduces support requests, and creates a stronger first impression of the brand.
We had a case where an online casino received $50,000 in deposits from one player in only seven minutes through five separate $10,000 transactions. At first, the team believed a new VIP or highroller had joined, but 12 hours later, the payment provider ordered the account to be blocked due to possible fraud. After investigation, all transactions were marked fraudulent as the scammer had used fake contracts to bypass the payment provider’s risk department and almost succeeded.
What protected the casino was its internal risk system, which restricted withdrawals until all checks were complete. Players should be paid promptly, but fast payouts only work when proper KYC, AML, fraud, and withdrawal controls are already in place.
AML Alert Volume and Resolution
AML alert volume measures how many transactions or accounts are flagged for risk review. AML means Anti-Money Laundering, which refers to controls that help prevent criminal funds from moving through the casino.
Resolution time, on the other hand, shows how quickly the risk team handles flagged cases. A sudden rise in alerts may point to fraud, payment abuse, bonus abuse, or unusual transaction behavior.
Operators must be wary of false positives too, since alerts that are not real risks can overwhelm the compliance team and slow down real players. Too many can signal a need to fine-tune your systems.
Customer Support Response Time
Quick, reliable support improves the player experience and is a key operational KPI. Strong service is essential for retention, since players reach out when money or identity issues arise.
Operators must track first-response and full-resolution times separately to see how quickly a request is acknowledged and how long it takes to resolve a problem, thereby exposing bottlenecks in support performance.
Group support issues by their root cause, such as payments, KYC, withdrawals, bonuses, or account access, for deeper insight. Clear breakdowns help management fix problems at the source, not just speed up responses.
Do not rely on AI customer support for serious casino issues involving money, KYC, blocked accounts, withdrawals, chargebacks, or VIP complaints. Automation can help route tickets, but real-money disputes need trained people who understand risk, compliance, and player trust.
KPI Relationships: How Metrics Tell the Real Story
Looking at KPI relationships reveals what is really happening, since isolated numbers can mislead. A strong metric in one area might hide bigger business problems elsewhere.
The key metric to watch is LTV-to-CAC (Lifetime Value to Customer Acquisition Cost), with a common target of at least 3:1. The right ratio depends on your market, license, payback period, and cash position.
GGR-to-active-player ratio shows if your users are generating real revenue, while bonus cost versus NGR tells you if promotions help or hurt margins. Payment success compared to registration-to-deposit reveals whether cashier failures are slowing growth.
The executive rule is to never trust one KPI alone. Casino operators lose money when they fall in love with one impressive metric. A good operator asks what the number hides, what it costs, and whether it repeats next month.
Building a Casino KPI Dashboard That Actually Works
A good KPI dashboard turns complex data into clear management decisions, showing what is growing, leaking money, or needs attention.
A practical dashboard should pull data from the casino platform, game aggregator, sportsbook provider, payment gateways, KYC vendor, CRM system, affiliate software, and support desk.
All data should feed into a structured database or data warehouse so the business uses consistent definitions. BI tools such as Metabase and Power BI can then display real-time and weekly management views.
The dashboard should allow executives to filter performance by market, license, traffic source, payment method, game provider, player cohort, and time period.
If you are planning to grow into new markets, it helps to choose licenses with your day-to-day operations in mind. LicenseGentlemen can help you match your license choices with real-world needs like payments, onboarding, and reporting, so you are ready before any problems show up in your dashboard.
Common Mistakes Operators Make When Tracking KPIs
Even experienced operators can make reporting mistakes that hide problems until they start affecting revenue. Reviewing KPIs regularly is important, but understanding how to interpret them correctly is what helps a casino grow sustainably.
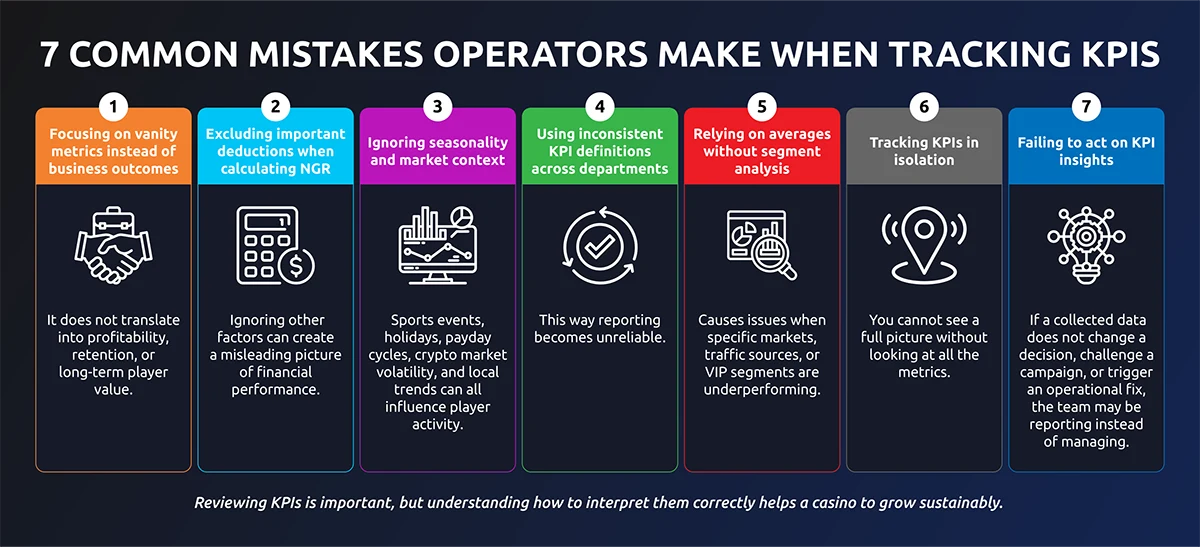
- Focusing on vanity metrics instead of business outcomes: Registrations, clicks, and deposits may look impressive on a dashboard, but they do not automatically translate into profitability, retention, or long-term player value. A dashboard full of green numbers can still describe a weak casino if the players do not return or deposit again.
- Excluding important deductions when calculating NGR: Looking only at GGR without factoring in bonuses, payment fees, taxes, affiliate commissions, and administrative costs can create a misleading picture of financial performance.
- Ignoring seasonality and market context: Sports events, holidays, payday cycles, crypto market volatility, and local trends can all influence player activity. Short-term changes should always be evaluated within a broader timeframe.
- Using inconsistent KPI definitions across departments: If finance, marketing, CRM, and product teams all define active players differently, reporting becomes unreliable and decision-making suffers.
- Relying on averages without segment analysis: Overall retention, payment success, or revenue figures may appear healthy while specific markets, traffic sources, or VIP segments are underperforming.
- Tracking KPIs in isolation: A strong metric rarely tells the full story on its own. Instead, acquisition costs should be compared with LTV, registrations should be reviewed alongside deposits, and GGR should always be evaluated alongside NGR.
- Failing to act on KPI insights: Collecting data is only valuable when it leads to operational improvements, marketing adjustments, product enhancements, or compliance upgrades. If a KPI does not change a decision, challenge a campaign, or trigger an operational fix, the team may be reporting instead of managing.
The most successful casino operators use KPIs as a decision-making framework rather than a reporting exercise. When metrics are tracked consistently, defined clearly, and analyzed together, they become one of the strongest tools for scaling an online gambling business.
If you are planning to launch or expand an online casino, sportsbook, or crypto gambling platform, LicenseGentlemen can help you secure the right iGaming license and build a compliant foundation for growth. With more than 500 successful licensing projects across multiple jurisdictions, our team helps operators enter regulated markets faster and with confidence.
FAQ
A KPI in gaming is a measurable indicator that shows how well a casino, sportsbook, or iGaming platform is performing. Common gaming KPIs include CPA, retention rate, churn rate, GGR, NGR, ARPU, payment success rate, KYC time, and player lifetime value.